Java Memory Model and Garbage Collection
How the JVM finds dead objects by reachability, why the heap is generational, what G1 and ZGC do, and what volatile and happens-before guarantee, with GC logs and a visibility test run on OpenJDK 21.
Java garbage collection frees an object when no chain of references from a GC root, such as a stack local or static field, reaches it. The Java memory model guarantees one thread sees another's write only across a happens-before edge. Interviewers expect the key detail: volatile gives visibility and ordering but not atomicity, so count++ can lose updates.
The JVM frees an object when no chain of references from a GC root reaches it, and it lets threads see each other's writes only across happens-before edges such as a volatile write and read. On OpenJDK 21 a 64 MB heap kept live data near 1 MB through young pauses, and a plain boolean flag hung a worker thread until I made it volatile.
- The HotSpot JVM traces reachability from GC roots rather than counting references, so cycles with no path from a root are collected.
- A Java memory leak happens when unused objects stay reachable, for example through a static list, because the collector frees only unreachable objects.
- JEP 248 made G1 the default garbage collector on server configurations in JDK 9, and on JDK 21 its default MaxGCPauseMillis is 200.
- ZGC left experimental status in JDK 15 (JEP 377), and from JDK 23 (JEP 474) plain -XX:+UseZGC selects generational mode.
- In the Java memory model, a write to a volatile field happens-before every later read of that field, which guarantees visibility of the write.
- On OpenJDK 21, four threads each doing 100,000 increments on a volatile int printed 395459 and 397062 in two of five runs, while AtomicInteger always gave 400000.
01Two questions the JVM answers
Interviewers who ask about the Java memory model and about garbage collection are really asking two things. First, where do objects live and how does the JVM know when one is dead? Second, when a thread writes a field, when is another thread guaranteed to read the new value? The first is the garbage collector's job. The second is the memory model's job. They look unrelated, yet both come down to what the JVM is allowed to assume: about which objects are still reachable, and about which writes other threads can see.
Everything below was run on OpenJDK 21.0.12.1 (Ubuntu build, Linux, 2 CPUs, 8 GB). Where a number appears, it came from that machine and will differ on yours. If you have not yet read how threads share an address space, start with the processes-vs-threads topic, because the memory model only matters once two threads touch the same object.
02Heap layout: eden, survivors, old generation
Every instance field, static field and array element lives in heap memory, and the heap is shared by all threads. Local variables and method parameters live in stack frames, one stack per thread, and are never shared. A local variable can hold a reference to a heap object, but the variable itself is private to its thread.
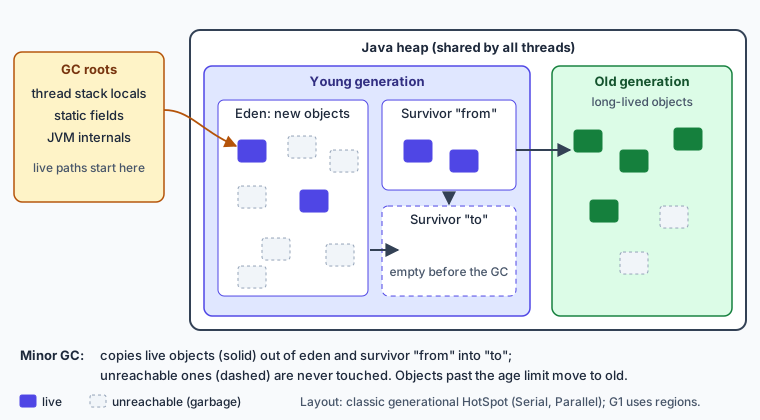
In the classic HotSpot layout the heap is split into a young generation and an old generation. The young generation has an eden space and two survivor spaces. New objects are allocated in eden. At any moment one survivor space is empty and is the destination for the next collection. The reason for the split is the weak generational hypothesis, which the Oracle GC tuning guide states as: "most objects survive for only a short period of time." If that holds, collecting a small young space often is cheap, because almost everything in it is already dead.
I printed the real layout with -Xlog:gc+heap=debug on the Serial collector and a 64 MB heap: eden 17472K, each survivor space 2176K, tenured generation 43712K. That is roughly an 8:1:1 split of the young generation (the default SurvivorRatio is 8 in PrintFlagsFinal), with the old generation taking about two thirds of the heap. G1 does not use fixed contiguous spaces like this, as the G1 section explains.
03Reachability: how the JVM decides an object is dead
HotSpot does not count references. It traces. The collector starts from GC roots, which are the references that are certainly in use: locals and parameters on thread stacks, static fields, and a few JVM internals. It follows every reference from those roots and marks each object it reaches. Anything unmarked is unreachable and its memory can be reused.
Two consequences. Cycles are not a problem: two objects that reference only each other, with no path from a root, are both unreachable and both collected. And the collector frees objects that are unreachable, not objects that are unneeded. If a static ArrayList keeps a reference to a buffer you will never read again, the buffer is reachable and stays.
That is how a Java program leaks. I ran a loop that adds 1 MB arrays to a static list with -Xmx32m. It stopped with OOM after holding 15 MB: Java heap space. The collector did nothing wrong; every array was reachable through the list. Typical real-world versions are an unbounded cache, a listener that is never unregistered, and a ThreadLocal value kept alive by a pooled thread.
The same reasoning explains why finalize() was a bad idea. Javac on JDK 21 with -Xlint:all warns that finalize() in Object has been deprecated and marked for removal. It was deprecated for removal in JDK 18 by JEP 421, which names try-with-resources and cleaners as the replacements.
04Generational collection: copy, sweep, compact
Three basic moves appear in collector descriptions. These are general algorithm descriptions, not claims taken from one vendor page. Mark finds the reachable objects, as above. Sweep walks memory and reclaims the unmarked ones, leaving holes. Compact slides the survivors together to remove the holes. A copying collector skips sweeping: it copies live objects into an empty area and then treats the whole old area as free.
A young collection is a copying collection. The live objects in eden and in the occupied survivor space are copied into the empty survivor space, and eden is then empty. Each copy bumps an age counter. When an object's age passes a threshold it is promoted to the old generation. On my machine MaxTenuringThreshold is 15, and the gc+age log showed objects accumulating in an age table: after the first young GC, 257,568 bytes at age 1; after the second, 174,568 bytes at age 1 and 257,464 bytes at age 2.
A minor collection collects only the young generation. A major or full collection collects the whole heap and usually takes much longer, according to the Oracle guide. The log line names the cause in parentheses: Pause Young (Allocation Failure) only means the young space filled up. Nothing failed.
Old-generation collectors often mark and then sweep or compact instead of copying, because copying a large, mostly live space would need as much free space as live data.
05G1 and ZGC: what each does and since which JDK
Version numbers matter here, because older articles describe settings that have changed.
G1. JEP 248 made G1 the default collector on server configurations in JDK 9, replacing Parallel GC. Its stated rationale: "limiting GC pause times is, in general, more important than maximizing throughput." G1 splits the heap into equally sized regions. Eden, survivor and old are sets of regions rather than fixed address ranges, and live objects are evacuated (copied) into other regions. After a concurrent marking cycle it runs mixed collections that also take some old regions. -XX:MaxGCPauseMillis is a soft pause goal. The Oracle G1 page that documents this is dated (it describes a JDK 7/8-era build), so I checked the default myself: PrintFlagsFinal on JDK 21 shows MaxGCPauseMillis = 200 and java -Xlog:gc -version printed Using G1 on this 2-CPU machine.
ZGC. It left experimental status in JDK 15 (JEP 377), where the maximum heap went from 4 TB to 16 TB. Generational ZGC arrived in JDK 21 (JEP 439) behind -XX:+UseZGC -XX:+ZGenerational. In JDK 23, JEP 474 flipped the default so plain -XX:+UseZGC selects the generational mode, and JEP 490 removed the non-generational mode in JDK 24. On my JDK 21, ZGenerational reported false. ZGC targets pauses under about a millisecond regardless of heap size, doing most work concurrently, with colored pointers and load barriers.
Parallel GC, which maximizes throughput, and Serial GC, a single-threaded collector for small heaps, are still available. No collector wins everywhere. The honest answer is to state the pause budget and heap size, then measure.
06Experiment: reading the GC log
The program allocates 200,000 byte arrays of 10 KB each (about 2 GB in total) and keeps every 200th one in a static list, so about 10 MB stays live.
static List<byte[]> keep = new ArrayList<>();
for (int i = 0; i < 200_000; i++) {
    byte[] tmp = new byte[10 * 1024];      // dies immediately
    tmp[0] = (byte) i; sink += tmp[0];
    if (i % 200 == 0) keep.add(new byte[10 * 1024]);   // retained
}
Run with -Xms64m -Xmx64m -Xlog:gc and one collector flag each. The first lines of real output:
Serial:   Pause Young (Allocation Failure) 18M->1M(61M) 1.813ms
G1:       Pause Young (Normal) (G1 Evacuation Pause) 7M->1M(64M) 4.585ms
          ... 26M->1M(64M) 1.004ms, then 38M->1M(64M)
Parallel: Pause Young (Allocation Failure) 17M->1M(61M) 3.857ms
The first pause of each run is the slowest, and later ones were mostly 0.4 to 2 ms. Serial did 60 to 64 young pauses across runs, Parallel about 53, G1 31. Heap occupancy after a young GC stays near 1 MB although 2 GB was allocated: the garbage dies young. G1 chose larger young sizes as it adapted (7 MB, 26 MB, then 38 MB), while Serial used a fixed 18 MB. None of these runs printed a Pause Full line.
ZGC told a different story. With -XX:+UseZGC -Xmx64m I got Garbage Collection (Warmup) 42M(66%)->16M(25%) followed by repeated Allocation Stall (main) 6.694ms lines, 37 stalls in one run: the program allocates faster than the concurrent collector reclaims in so little space. With -Xmx512m I saw no stalls, and generational ZGC on the small heap still stalled (31 times). So ZGC wants headroom; a 64 MB toy heap is the wrong place to judge it.
To force old-generation work I kept every 20th array instead, which is 100 MB of live data, more than the heap. Serial printed Pause Full (Allocation Failure) 60M->44M(61M) 10.752ms first, ran 24 full collections in all, and finally threw OutOfMemoryError: Java heap space. Keeping every 100th (20 MB live) produced only young pauses, with the post-GC heap creeping up to 11M and 13M as the retained list grew.
One more run checks a common tutorial claim about System.gc(). Called in an otherwise empty program under G1, it printed Pause Full (System.gc()) 1M->1M(10M) 4.858ms. Adding -XX:+DisableExplicitGC printed nothing after Using G1. So it is a request that this JVM honored by default and ignored under a flag, not a command.
07The Java memory model: happens-before and volatile
The Java Language Specification (chapter 17) defines which writes a thread may see. Two accesses to the same variable conflict if at least one is a write. If conflicting accesses are not ordered by a happens-before relationship, the program has a data race and the language promises very little about what a read returns.
Happens-before comes from specific actions: an unlock of a monitor happens-before every later lock of the same monitor; a write to a volatile field happens-before every later read of that field; Thread.start() happens-before everything in the started thread; and everything in a thread happens-before another thread returns from join() on it. Ordinary program order inside one thread counts too.
Here is the standard demonstration. The worker spins on a plain boolean field while main sleeps one second, sets the field, and waits up to three seconds.
static boolean stop;   // second run: static volatile boolean stop;
Thread t = new Thread(() -> { long n = 0; while (!stop) n++; });
t.start(); Thread.sleep(1000); stop = true; t.join(3000);
Results on OpenJDK 21: with the plain field, two runs out of two printed worker STILL RUNNING (never saw write). With volatile, it printed worker saw stop, n>0=true and worker exited. Then I ran the plain version with java -Xint, which disables the JIT compiler: the worker exited normally.
That last result is the real lesson. The hang is not guaranteed by the language. Most likely the JIT compiler saw that nothing in the loop writes stop and hoisted the read: it read the field once and reused the value, and that is a legal transformation for a racy program. In the interpreter the field is re-read every iteration and the bug hides. A data race means no guarantee, not guaranteed failure, which is why such bugs survive testing.
Volatile gives visibility and ordering but not atomicity. I ran 4 threads doing 100,000 v++ each on a volatile int and on an AtomicInteger. The atomic always printed 400000. The volatile int printed 400000 in three of five runs and 395459 and 397062 in the other two. Increment is read, add, write, and two threads can both read the same old value. The only atomicity volatile adds is for long and double, whose plain writes may be split in two 32-bit halves.
08Common interview questions
Q: How does Java garbage collection work?
A: The collector starts at GC roots (stack locals, statics), marks everything reachable, and reclaims the rest. Most collectors are generational because most objects die young: a minor GC copies the few live objects out of eden into survivor space, and objects that survive enough collections are promoted to the old generation.
Q: What is the difference between a minor GC and a full GC, and why do full GCs hurt?
A: A minor GC collects only the young generation and touches few live objects. A full GC collects the whole heap and usually pauses much longer. Common causes are a full old generation and an explicit System.gc(), which showed as Pause Full (System.gc()) in my log.
Q: G1 or ZGC?
A: It depends on the pause budget and heap size. G1 is the default since JDK 9 and aims for a soft 200 ms pause goal. ZGC aims for pauses around a millisecond independent of heap size but needs headroom, and plain -XX:+UseZGC is generational only from JDK 23. Measure with -Xlog:gc instead of picking one by reputation.
Q: What does volatile do? Is count++ on a volatile int safe?
A: A volatile write happens-before every later read of that field, so a reader that sees the new value also sees every write the writer made before it; the compiler and CPU may not move those earlier writes past the volatile write. count++ is a read-modify-write and not atomic, so it loses updates; use AtomicInteger or synchronized.
Q: What is happens-before?
A: A partial order on actions. If A happens-before B, B sees A's effects. Edges come from monitor unlock and lock, volatile write and read, Thread.start and Thread.join. Conflicting accesses with no such edge are a data race.
Q: Can a Java program leak memory? Is Java pass-by-reference?
A: Yes to the first: reachable but unused objects, such as entries in a static collection, are never freed. No to the second: Java passes references by value. In my test a swap(p, q) method printed A B, unchanged, while append(p) printed A! because the method mutated the shared object.